|
Visualizing Multiwavelength Astrophysical Data
Hongwei Li,
Chi-Wing Fu,
and Andrew J. Hanson |
Abstract
With recent advances in the measurement technology for allsky astrophysical imaging, our view of the sky is no longer limited to the tiny visible spectral range over the 2D Celestial sphere. We now can access a third dimension corresponding to a broad electromagnetic spectrum with a wide range of allsky surveys; these surveys span frequency bands including long wavelength radio, microwaves, very short X-rays, and gamma rays. These advances motivate us to study and examine multiwavelength visualization techniques to maximize our capabilities to visualize and exploit these informative image data sets. In this work, we begin with the processing of the data themselves, uniformizing the representations and units of raw data obtained from varied detector sources. Then we apply tools to map, convert, color-code, and format the multiwavelength data in forms useful for applications. We explore different visual representations for displaying the data, including such methods as textured image stacks, the horseshoe representation, and GPU-based volume visualization. A family of visual tools and analysis methods is introduced to explore the data, including interactive data mapping on the graphics processing unit (GPU), the mini-map explorer, and GPU-based interactive feature analysis.Results
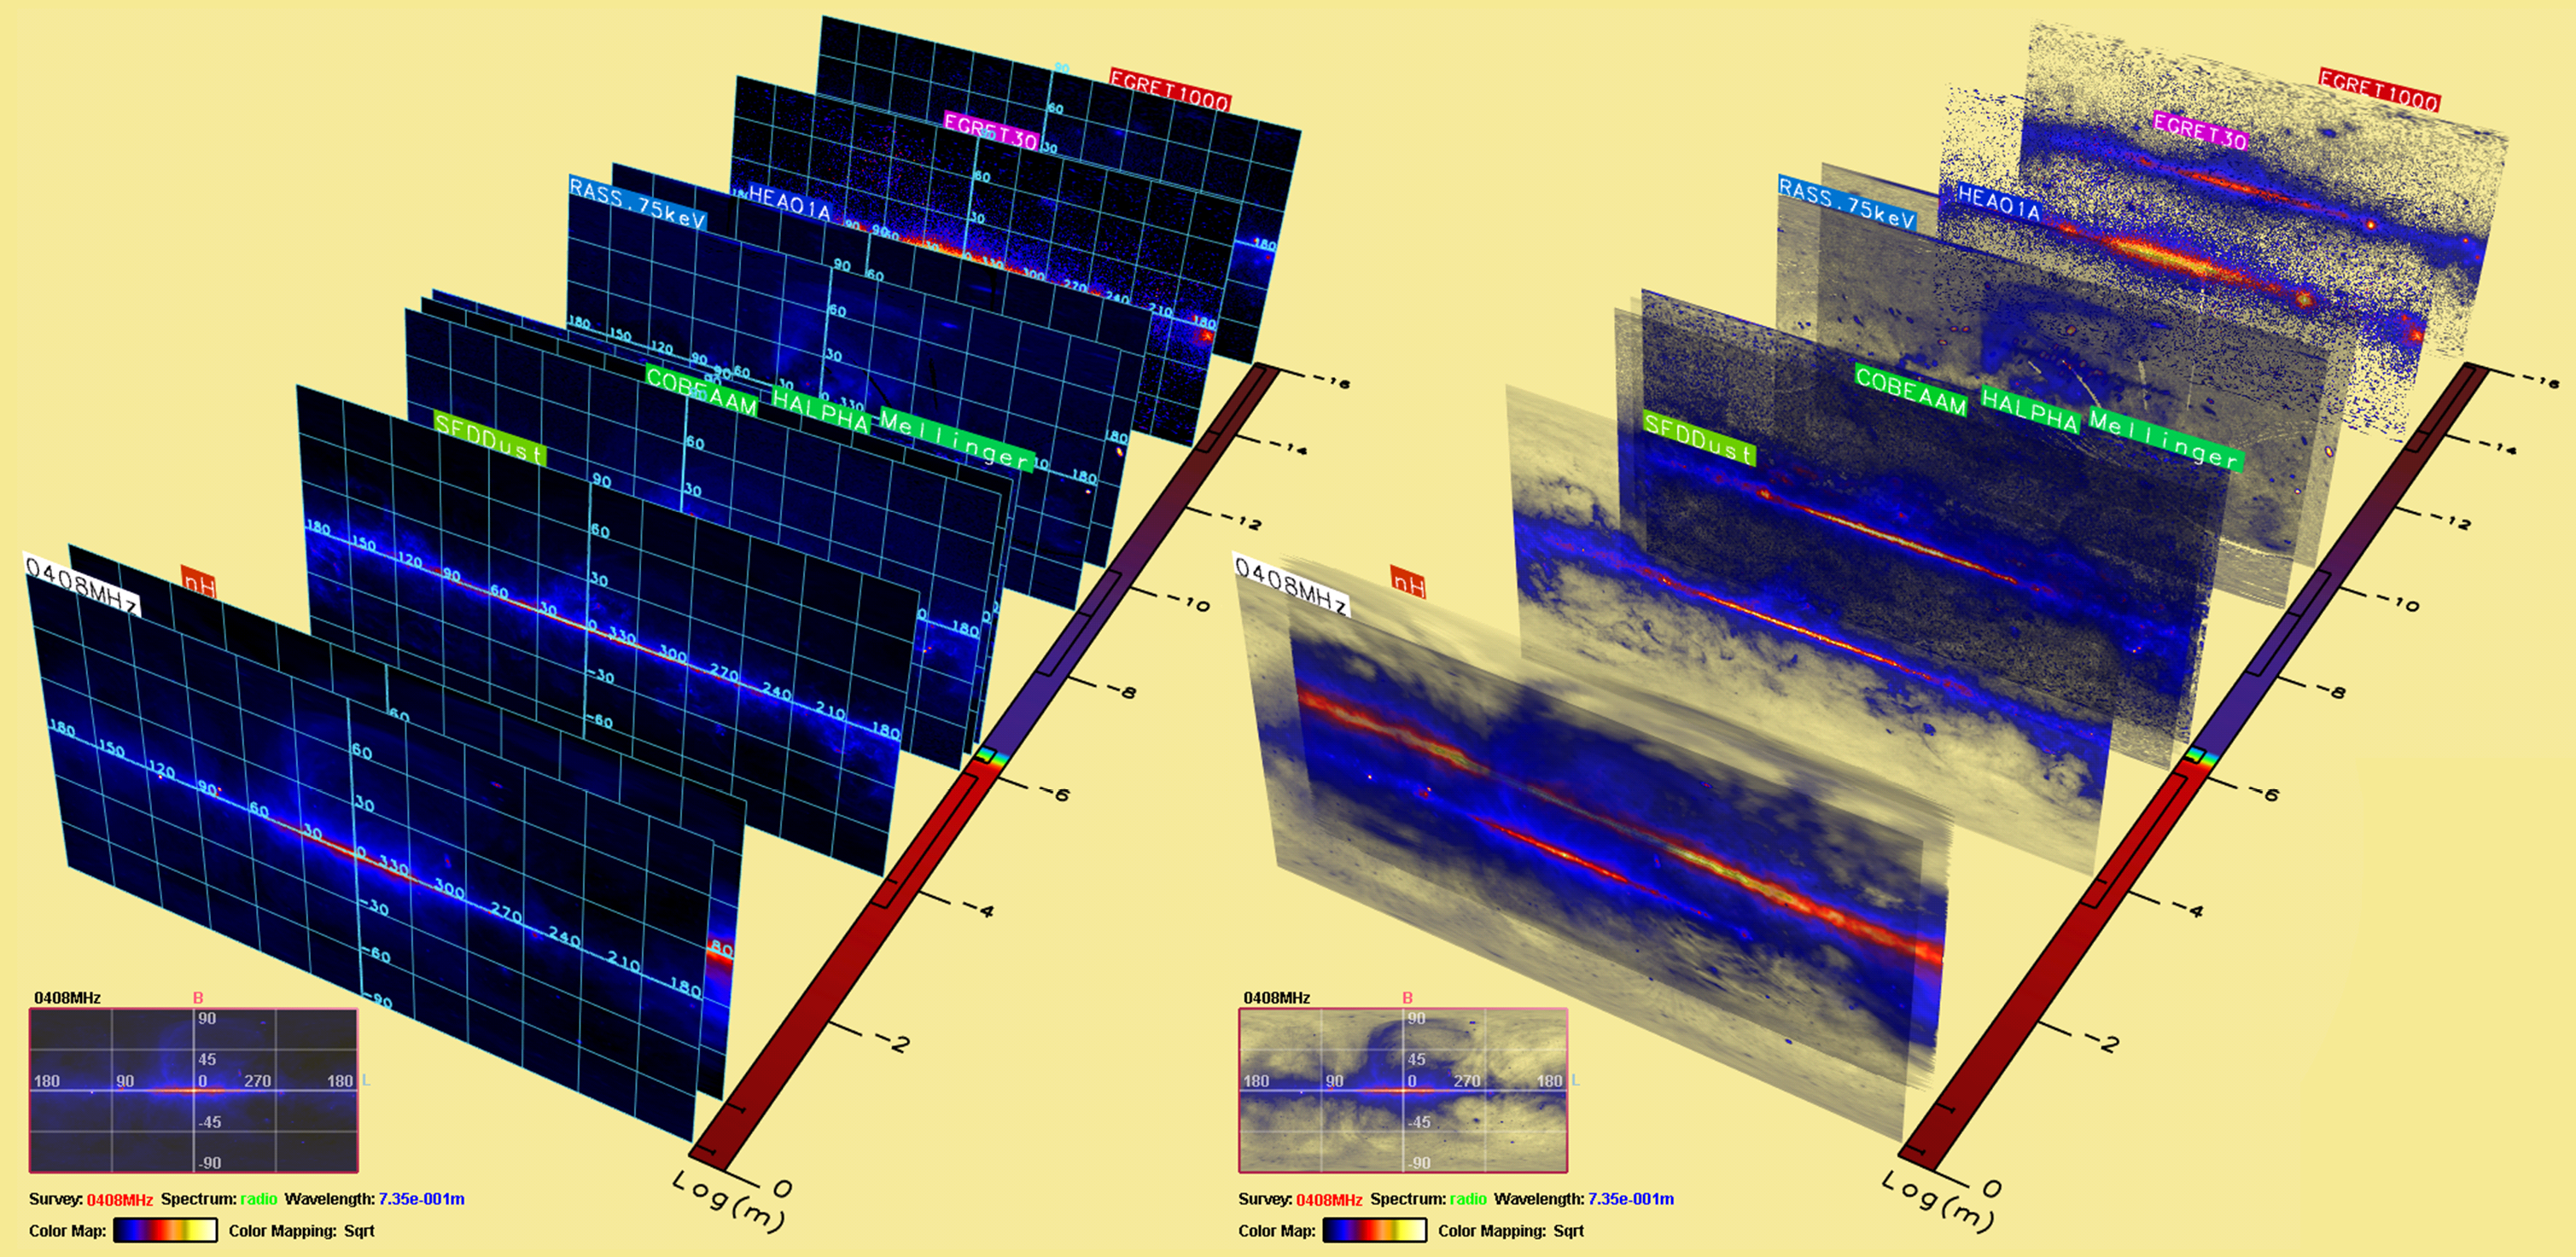
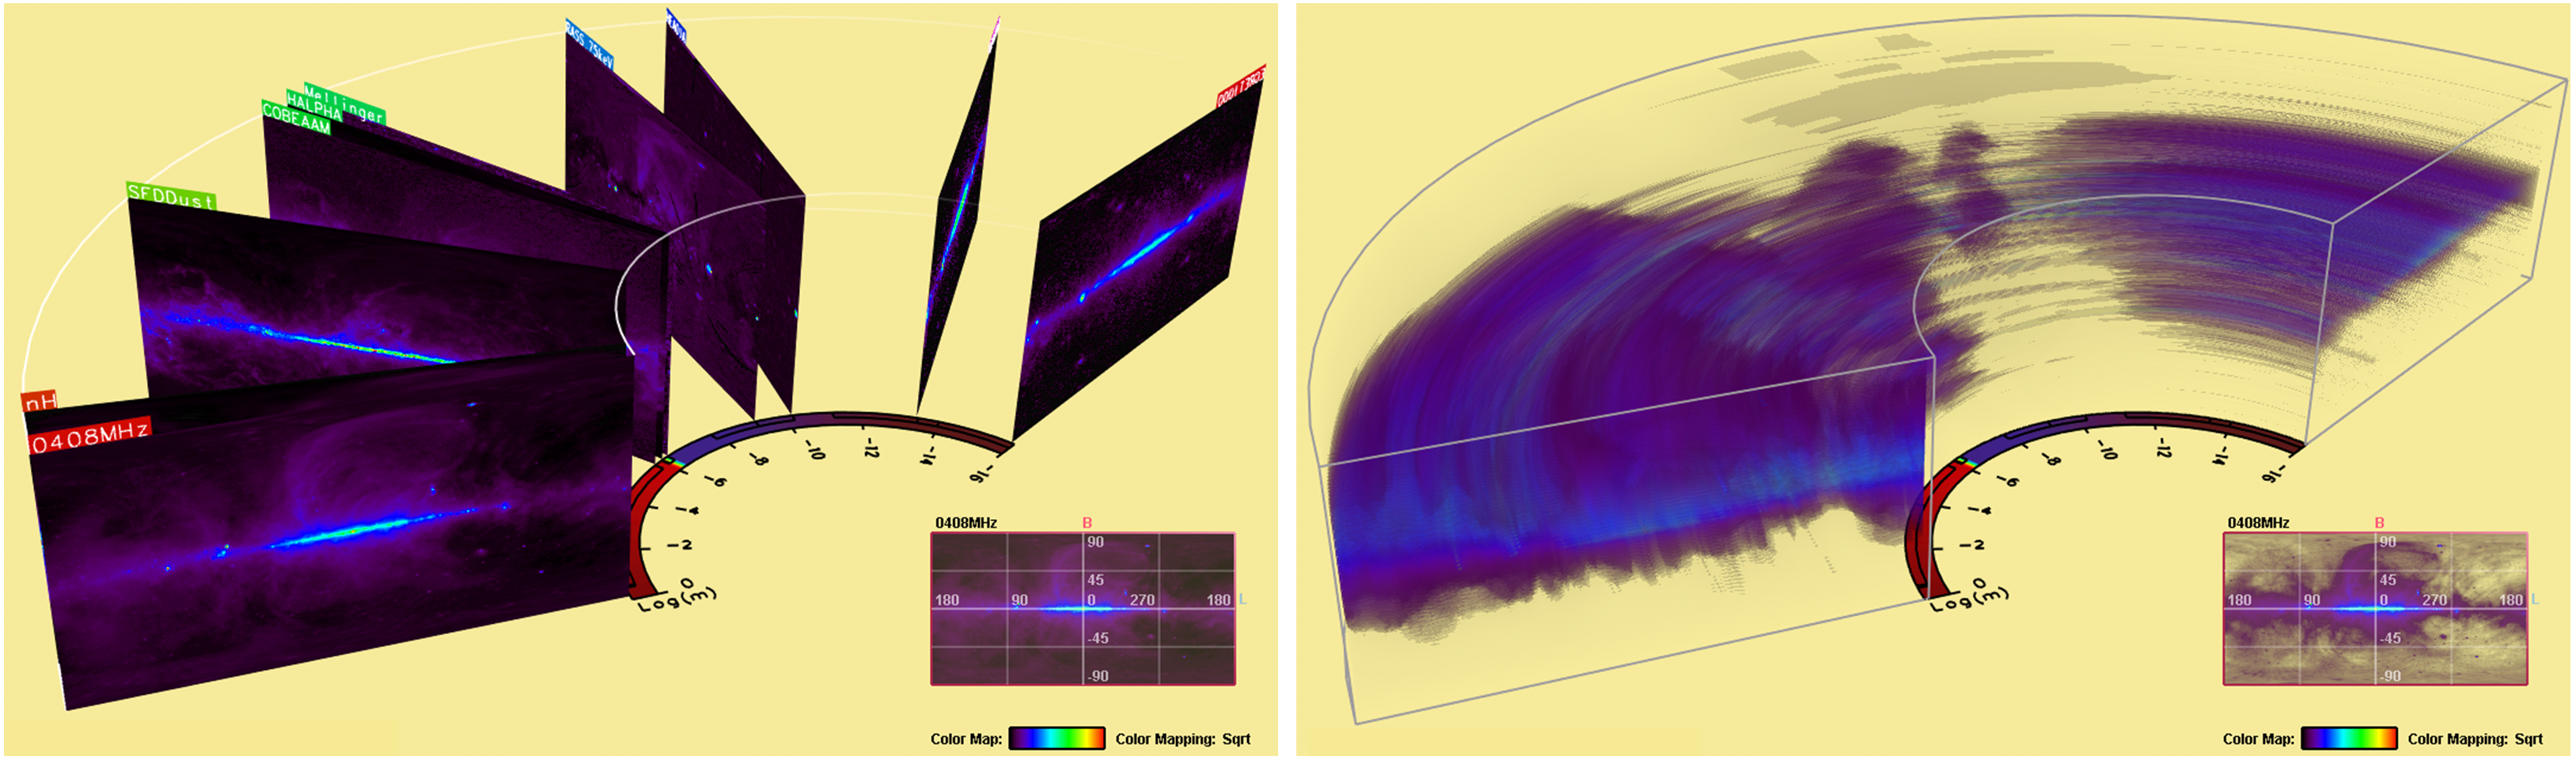
- Image-stacked mode:

Image-stack model showing the image of the Milky Way Galaxy across different wavelength bands. (Left) With Galactic coordinate grid and no transfer function. (Right) With transfer function enabled (tunable transparency on some pixels). The tags attached to the images indicate the data source. Moreover, we show also a color map on the right of the image stack to highlight the visible range location.
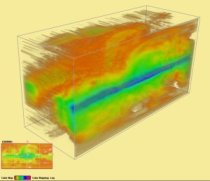
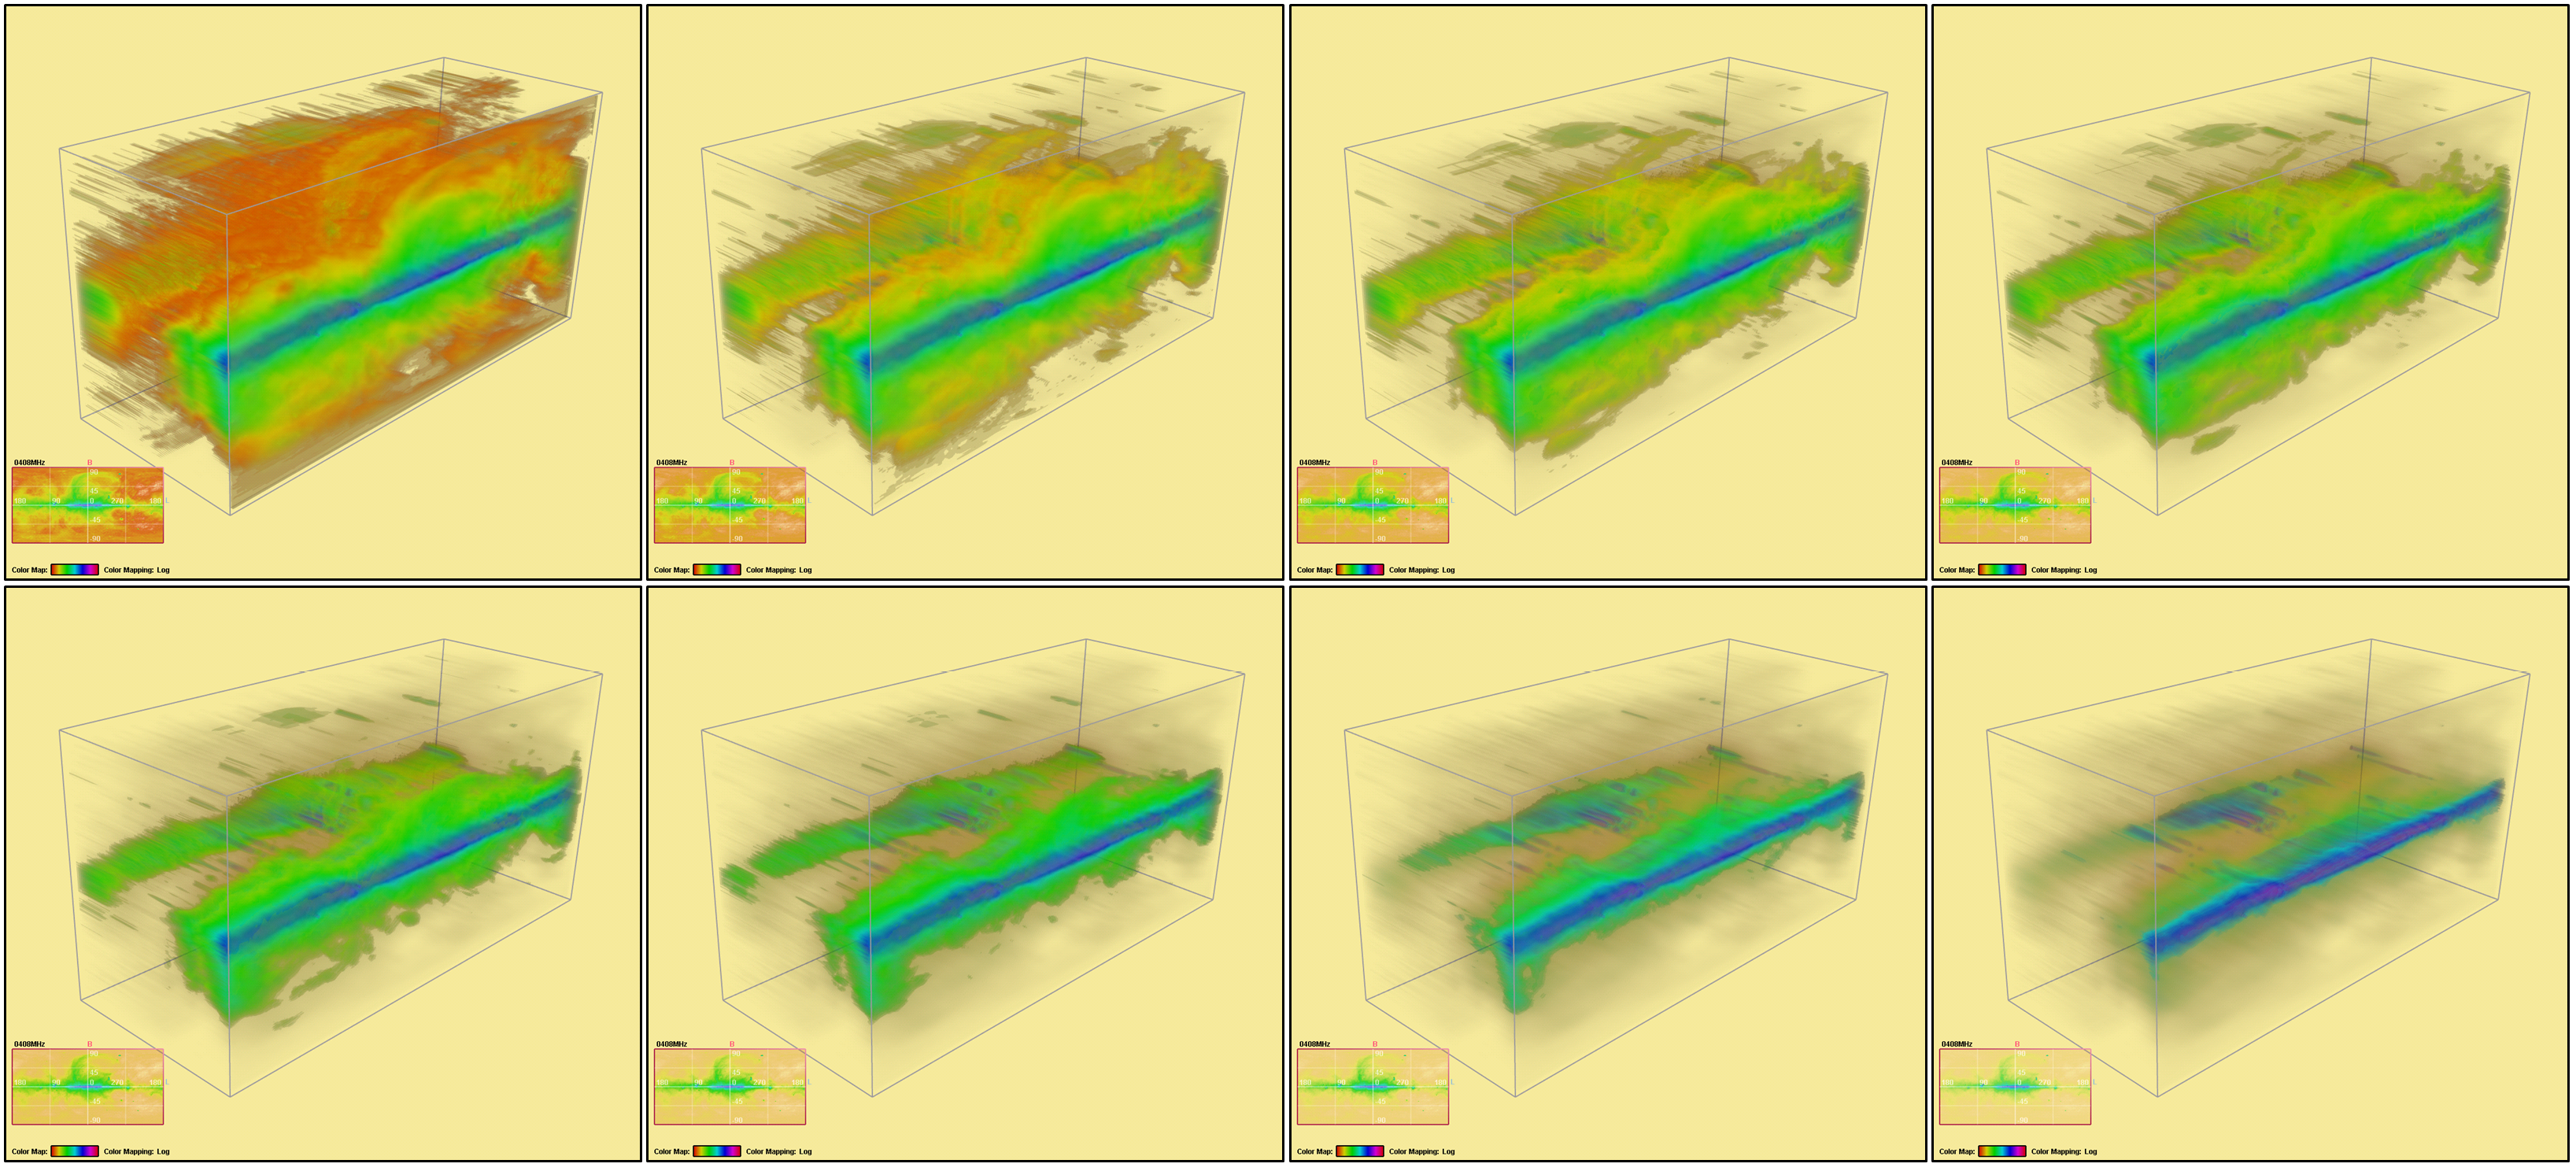
- Volume-rendered mode:
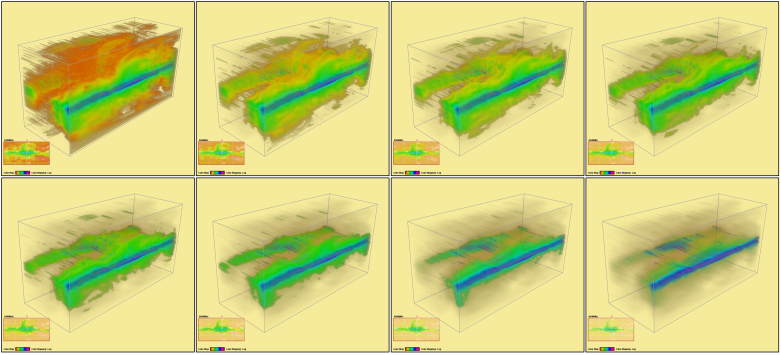
Volume-rendered model on the multispectral wavelength data: An image sequence depicting a continuous change in the transfer function (left to right, and then top to bottom).
- Horseshoe mode

Horseshoe view of the above two models. (Left) Combined with textured image-stack model. (Right) Combined with volume-rendered model (Note: Please refer to the manuscript for the detail).
Download
Click the following link to download:- Manuscript: download (~15.8 MB)
- Animation demo: download (~48.2 MB)
Encoded in AVI format using DIVX codec: WIN or MAC
BibTex
@article{li-2008-multiwavelength,author = {Hongwei Li and Chi-Wing Fu and Andrew J. Hanson},
title = {Visualizing Multiwavelength Astrophysical Data},
journal = {IEEE Transactions on Visualization and Computer Graphics (IEEE Visualization 2008)},
month = {Nov.-Dec.},
year = {2008},
volume = {14},
number = {6},
pages = {1555--1562},
}