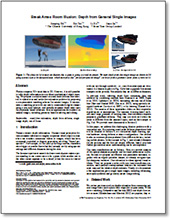
Break Ames Room Illusion: Depth from General Single Images
Jianping Shi1
Xin Tao1
Li Xu2
Jiaya Jia1
1The Chinese Univeristy of Hong Kong 2SenseTime Group Limited
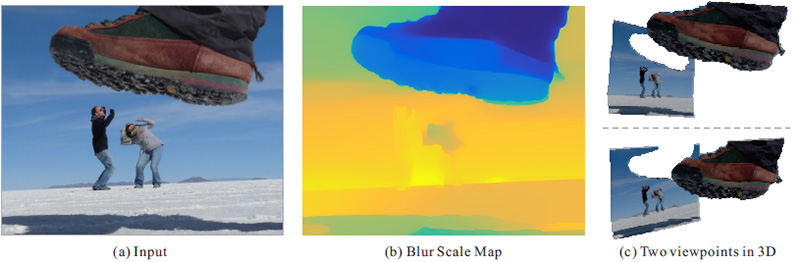 |
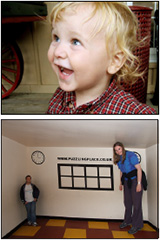
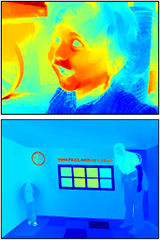
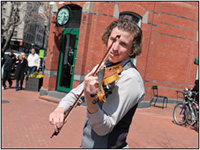
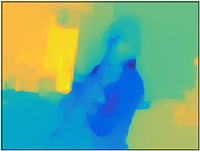
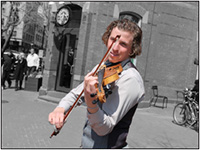
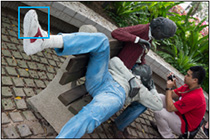
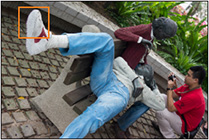
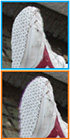
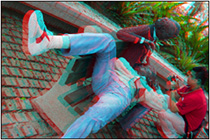
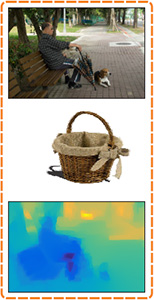
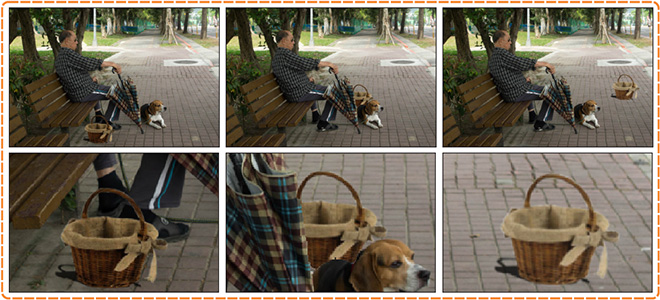
Fig. 1 The photo in (a) creates an illusion that a giant is going to tread on people. We infer depth from this single image as shown in (b) using special cues to be discussed later, which interprets this “forced perspective image” correctly from a geometry-layer point of view in (c). |
Abstract
Photos compress 3D visual data to 2D. However, it is still possible to infer depth information even without sophisticated object learning. We propose a solution based on small-scale defocus blur inherent in optical lens and tackle the estimation problem by proposing a non-parametric matching scheme for natural images. It incorporates a matching prior with our newly constructed edgelet dataset using a non-local scheme, and includes semantic depth order cues for physically based inference. Several applications are enabled on natural images, including geometry based rendering and editing.
Downloads
Our Method
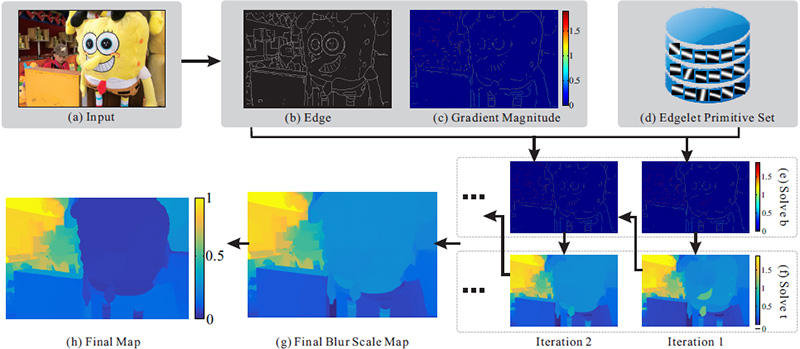 |
Fig. 2 Overview of our method. We detect edges in (b) from input (a). They are fitted into our atching and optimization framework that includes edgelet primitives (d). During alternating optimization, we solve for the sparse edgelet blur scale map shown in (e) and the global estimates in (f). The final depth map (h) is constructed by another optimization pass involving the final defocus blur scale estimate (g). |
Experiments
 |
 |
 |
 |
 |
| (a) Input |
(b) Zhu el al. 2013 |
(c) Bae and Durand |
(d) Shi et al. 2015 |
(e) Ours |
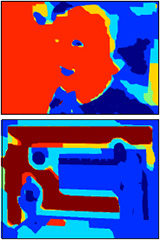
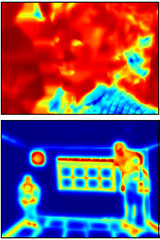
Fig. 3 Comparison with other single image defocus blur estimation methods. The Blue region is clear and the red pixels are blurred. The scale of the color bar indicates the blurriness.
 |
 |
 |
 |
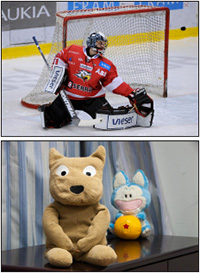
| (a) Input |
(b) Saxena et al. 2005 |
(c) Hoiem et al. 2007 |
(d) Ours |
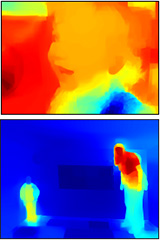
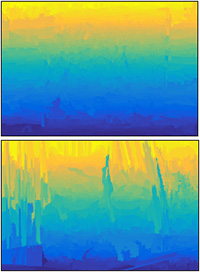
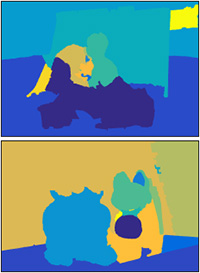
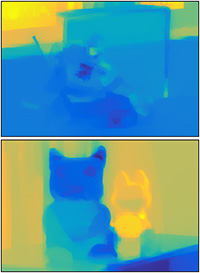
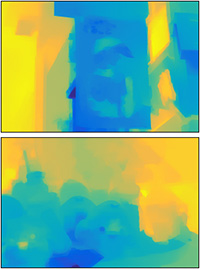
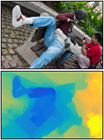
Fig. 4 Comparison with data-driven image depth inference methods. The blur region is close to camera, whereas the yellow one is from afar. The scale of the color bar indicates the normalized depth.
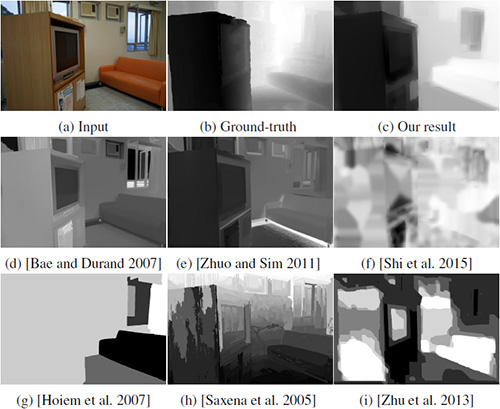
Fig. 5 Visual comparison on our benchmark data.
| Methods |
Rel |
Log10 |
RMSE |
RelOrder |
| Bae and Durand 2007 |
1.2880 |
0.3600 |
0.3528 |
0.0921 |
| Zhuo and Sim 2011 |
1.2597 |
0.3178 |
0.3210 |
0.1506 |
| Zhu et al. 2013 |
1.0775 |
0.5793 |
0.4383 |
0.0386 |
| Shi et al. 2015 |
1.6756 |
0.2866 |
0.3055 |
0.1854 |
| Saxena et al. 2005 |
1.0027 |
0.3170 |
0.3006 |
0.1288 |
| Hoiem et al. 2007 |
1.4317 |
0.4621 |
0.4082 |
0.0160 |
| Ours |
0.8997 |
0.2637 |
0.2681 |
0.1954 |
Table. 1 Quantitative evaluation on our data.
Applications
 |
 |
 |
| (a) Input |
(b) Blur Scale Map |
(c) Refocus Result |
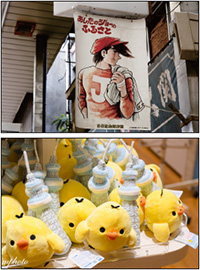
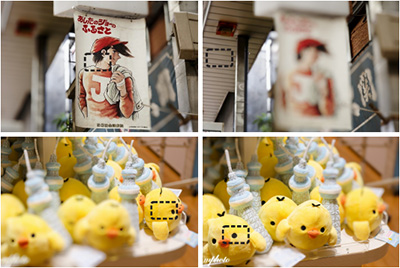
Fig. 6 Image refocus using our estimated blur scale maps. The black boxes highlight our focusing points.
 |
 |
 |
 |
| (a) Input |
(b) Blur Scale Map |
(c) Foreground |
(d) Background Color Removal |
Fig. 7 Automatic foreground-background segmentation and background decolorization using our estimated blur map.
 |
 |
 |
 |
 |
| (a) Input & Blur Scale |
(b) Left |
(c) Right |
(d) Close-up |
(e) Anaglyph 3D Image |
Fig. 8 Stereo image generation using our estimated defocus blur map.
 |
 |
| (a) Input & Blur Scale |
(b) Output Image and Closeup |
Fig. 9 Blur-aware image composition given our defocus blur estimates and depth maps.
 |
 |
 |
| (a) Input |
(b) Blur Scale Map |
(c) Manipulate Lighting |
Fig. 10 Lighting manipulation using our estimated small-scale
defocus map.
Related Projects
Reference
[1] BAE, S., AND DURAND, F. 2007. Defocus magnification. Computer Graphics Forum 26, 3, 571–579.
[2] HOIEM, D., STEIN, A. N., EFROS, A. A., AND HEBERT, M. 2007. Recovering occlusion boundaries from a single image. In ICCV, 1–8.
[3] SAXENA, A., CHUNG, S. H., AND NG, A. Y. 2005. Learning depth from single monocular images. In NIPS, 1–8.
[4] SHI, J., XU, L., AND JIA, J. 2015. Just noticeable defocus blur detection and estimation. In CVPR, 1–8.
[5] ZHUO, S., AND SIM, T. 2011. Defocus map estimation from a single image. Pattern Recognition 44, 9, 1852–1858.
[6] ZHU, X., COHEN, S., SCHILLER, S., AND MILANFAR, P. 2013. Estimating spatially varying defocus blur from a single image. TIP 22, 12, 4879–4891.