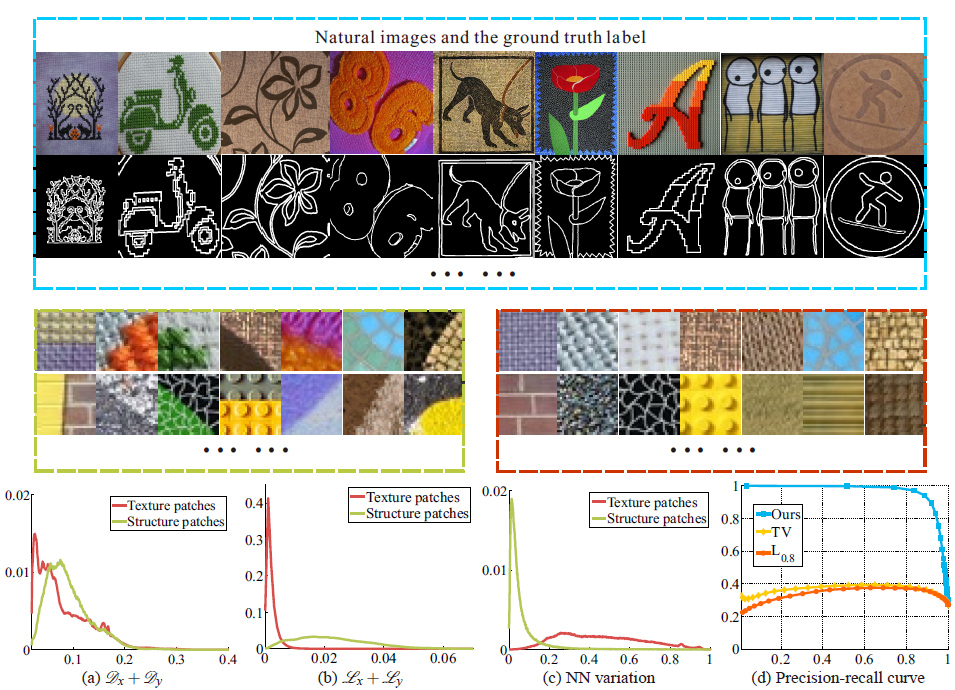

To evaluate our normalized natural variation measure quantitively, we collected 200 images from internet, and asked five helpers to label the structure in each image. Some sample images are shown in the above figure. The bottom row are plots of the distribution of total variation , natural variation
, NN variation and precision-recall of three measures. Click here to download the images and our ground truth labels.